
Have you ever found yourself in need a BAQ or Dashboard with one or more running totals or perhaps running totals over different ranges or rows and just didn't know how to do it - or worse, were told it wasn't possible? With Epicor 10 running on a MS SQL database, BAQs are much more powerful and most of the time you have the entire MS SQL feature set to work with. Unfortunately, most Epicor administrators and power users are used to the previous Progress database and are not familiar with the many MS SQL options.
In this post, I'm going to go over a quick and useful way to get various running totals in your BAQ results. When working with the Epicor 10 BAQ Designer, you have to create a calculated field to access many of the Functions needed to get to the data you need. One of the first things I noticed when I first used the Epicor 10 BAQ Designer was that the Functions list looked very much like it did in Epicor 9 and many of the more advanced functions were not available. I suspect this is because of two major reasons:
These are very good reasons but if you are familiar with MS T-SQL or are running into perceived limitations with the BAQ Designer, you should know that most of the other SQL functions will work in the BAQ designer, you just need to manually enter them. Usually, if you need an Aggregate Sum(), Avg(), Count(), you would be doing these functions across the fields that you mark for Group By, but what if you need something more complex? Like multiple groups, or multiple aggregates over different groups? You may have tried using another subquery or Epicor's Summary table, and this may or may not have worked for you. That is when the OVER() clause comes in.
The OVER() clause provides a way to perform various functions over different sets of data in different ways. Instead of providing a technical guide to the OVER() clause, I will leave that to Microsoft. Instead, I will provide a few examples: Say you want a dashboard that will show the total Qty Shipped each day with a monthly running total and a monthly Daily Average. This example should demonstrate how various functions can be mixed on the data set and still function independently.
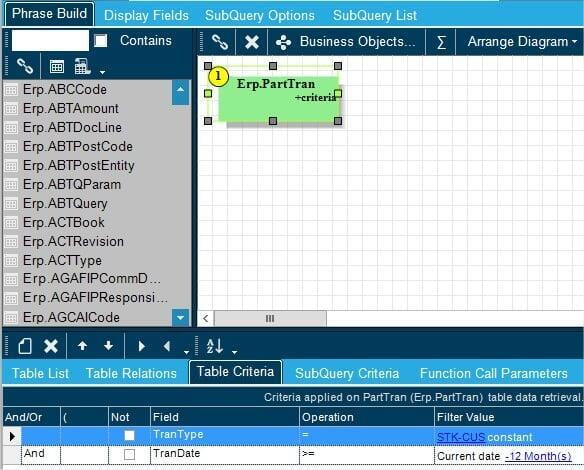
Create a new BAQ and add the Part Tran table to the Phrase Build.
Add a criteria where TranType = STK-CUS.
You should also add a date range, start with the last 3 months, where TranDate >= Current Date - 3 Months.
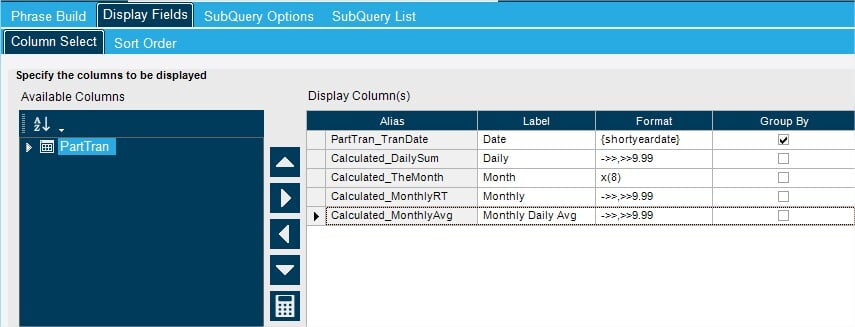
Select the Display Fields and add the TranDate to the Display Columns list and enable Group By.
Select the Sort Order tab and add TranDate and change the sort to descending by double clicking on the sort indicator icon.
Back on the Column Select tab, click on the Calculated Field Editor button.
Here create four calculated fields:
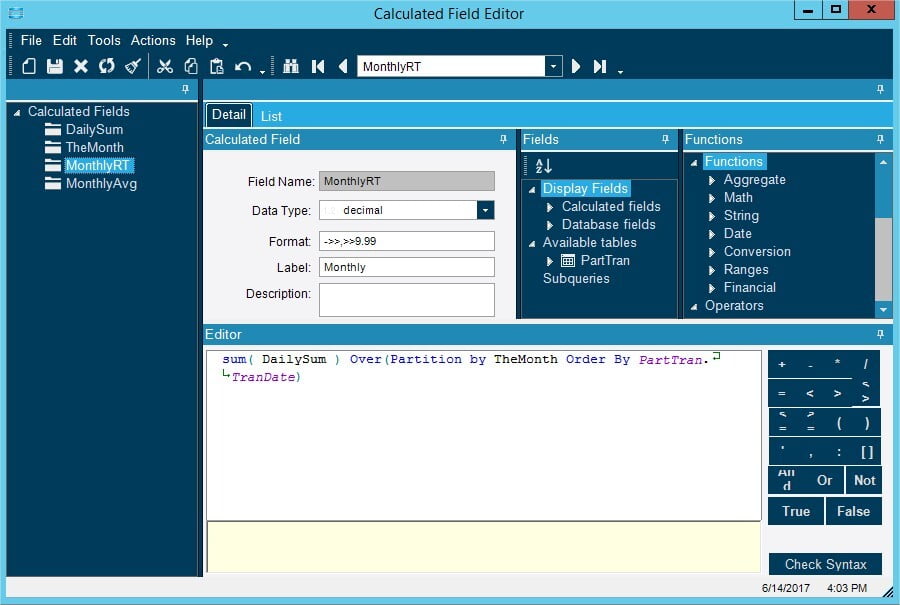
2. Month - In order to group the running totals and averages by month we will need a field that provides the month:
1. Field Name: TheMonth
2. Data Type: nvarchar
3. Label: Month
4. Calculation: Format(PartTran.TranDate, 'MM/yy')
5. Save and close out of the Calculated Field Editor.
6. Select the Analyze tab. Next, click on the Analyzebutton located in the lower left corner and ensure that the Syntax is OK to make sure we entered everything correctly.
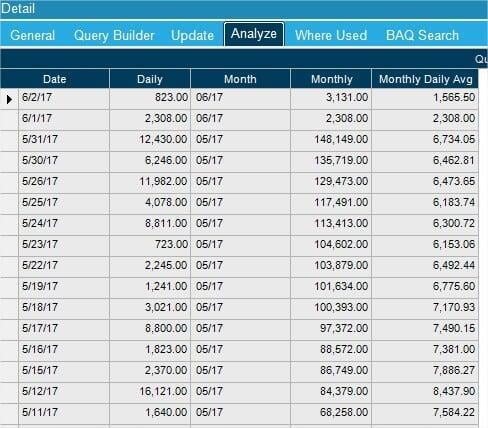
If you get concerned, just click on the X button that appears next to the Clear Grid button while a query is running.
As we can see, we get exactly what we were looking for - all with a single table query that runs quick. This feature offers numerous applications. You may have thought of some already, or perhaps there are existing BAQs you could benefit with this powerful SQL clause.
When you are asked to build a BAQ for a dashboard or BAQ Search, it may seem complex and at first it may seem complex, but the more familiar you are with the available functions, the easier it becomes. Here are a few ideas on where the Over() clause can be used:
- Daily, Weekly, Monthly, Yearly Shipping Metrics
- Released Job Material demand by part ordered by Material Req Date
- Daily, Weekly Monthly & Yearly Sales Metrics (by customer, salesman, territory, etc)
- Daily, Weekly, Monthly, Yearly Job Resource production qty.
- Part Transaction count by User or Employee ID